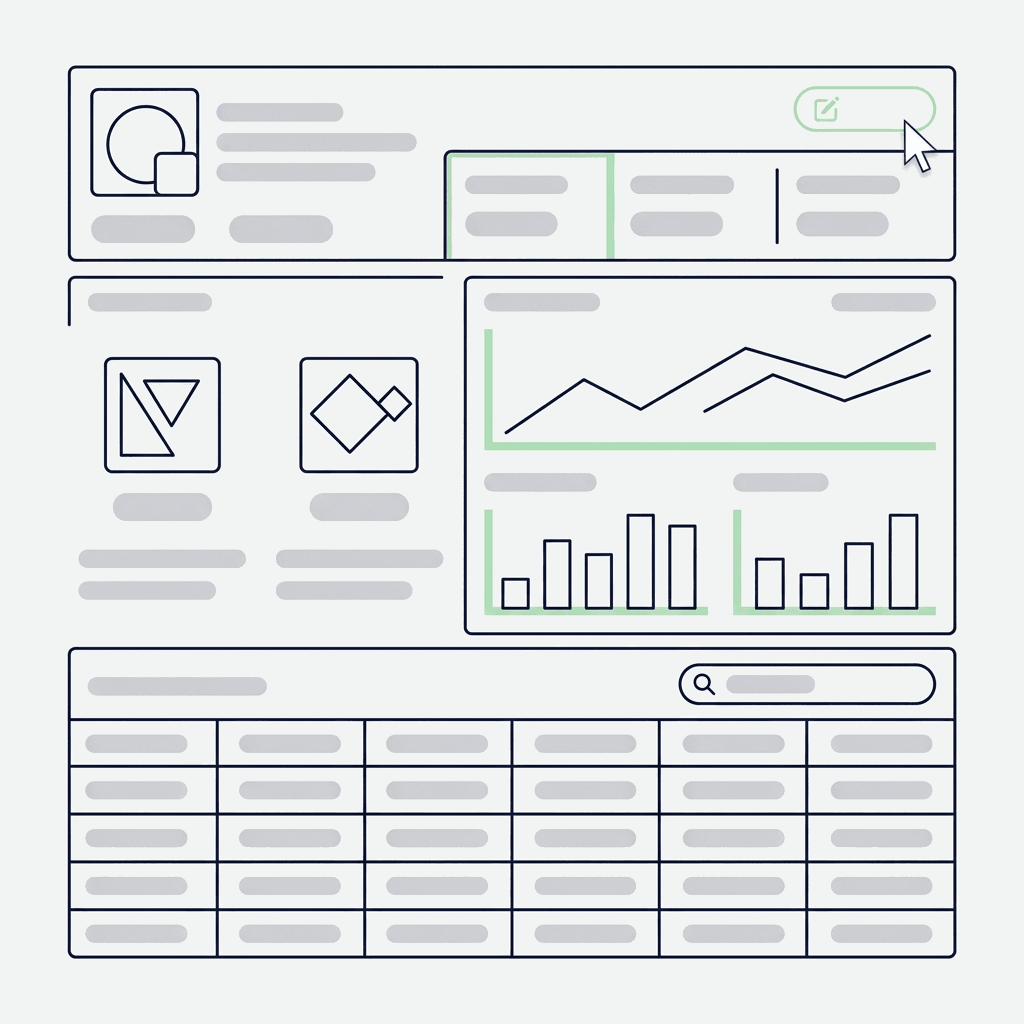
Every marketing team has dashboards. Most of them are largely decorative.
Not because the data is wrong, and not because the team lacks analytical capability. They are decorative because they are built to report on activity rather than to drive decisions. They tell you how many people visited your website, how many emails were opened, how many leads were generated. They do not tell you why performance changed, what is causing the gap between your current trajectory and your target, or what you should do differently starting tomorrow.
This is the difference between a dashboard and intelligent reporting, and it is one of the most consequential distinctions in modern marketing infrastructure.
The Problem With Activity-Based Dashboards
Activity metrics are easy to populate and comfortable to review. Impressions went up. Traffic increased. Open rates held steady. These numbers create the feeling of progress without providing the clarity necessary to generate it.
The fundamental issue is that activity metrics are not connected to outcomes in any causal model. A marketing team can hit every activity target across every channel and still miss revenue goals by a wide margin. When this happens, an activity dashboard cannot tell you which specific choices led to the miss because it was never built to answer that question.
The question every dashboard should be designed to answer is not "what happened" but "what should we do next." That requires a fundamentally different reporting architecture.
According to Forrester's Marketing Measurement Benchmark, only 14% of B2B marketing teams report that their current measurement systems give them confidence in making budget allocation decisions. The other 86% are flying partially blind.
The Three Layers of an Intelligent Reporting System
Layer One: Outcome Attribution. This is the foundation that makes everything else meaningful. Outcome attribution is the practice of connecting specific marketing activities to specific revenue outcomes with documented evidence of causality. It requires integration between your marketing platform, your CRM, and your revenue reporting so that you can answer questions like: which content assets were most frequently consumed by leads who eventually converted? Which channels sourced the leads with the shortest sales cycles? Which campaigns drove the highest lifetime value customers rather than just the highest volume of initial conversions?
Building this layer requires more technical investment than most teams make initially, but without it, every budget decision is a guess dressed up in confident language.
Layer Two: Trend Intelligence. Point-in-time metrics tell you your current state. Trend intelligence tells you your trajectory. A team whose conversion rate is 3.2% this week needs to know whether that is up from 2.1% three months ago or down from 4.8%. The direction and velocity of change is often more strategically important than the absolute number.
Design your reporting to surface leading indicators alongside lagging ones. Engagement depth on new content often predicts conversion rate changes four to six weeks before they appear in downstream metrics. If you monitor only conversions, you miss the early warning system that would let you intervene before the miss becomes visible.
Layer Three: Diagnostic Diagnostics. When performance deviates from plan, your reporting system should immediately narrow the field of possible causes. Did traffic decline, or did traffic hold but conversion rate drop? If conversion dropped, was it uniform across all channels or concentrated in one? If concentrated in one channel, was it a change in audience quality, messaging fit, or landing page performance?
A diagnostic reporting layer passes your raw metrics to a strategic AI agent and surfaces the relevant context automatically rather than requiring an analyst to manually investigate each deviation.
![]()
Connecting Marketing Reports to Revenue Conversations
One of the most persistent frustrations for marketing leaders is the inability to translate their performance data into language that resonates in a revenue conversation.
When a CFO asks what return the company is getting on its marketing investment, a response involving impressions and open rates produces skepticism. A response that traces specific campaigns to pipeline contribution, average deal size influenced, and closed revenue attributable to marketing-sourced leads produces partnership.
Building this translation requires that your reporting system is built around revenue stages from the outset. Not "we generated 2,400 MQLs this quarter" but "of the 2,400 MQLs we generated, 340 progressed to SQL, representing 18M in pipeline, of which 4.2M has closed to date at an average sales cycle of 47 days."
The Tractn analytics platform is built to surface this chain of attribution so that marketing leaders have the evidence they need to make the case for investment and the precision they need to allocate it wisely. You can see how this connects to our broader intelligence hub approach.
Making Reporting a Decision-Making Ritual
The best reporting system in the world produces no value if it is not reviewed and acted upon regularly.
Build a weekly reporting ritual structured around three questions: What changed this week that we did not expect? What does that change tell us about our strategy? What are we doing differently as a result?
The third question is the one most teams skip. They review the data, note the patterns, and then return to executing the same plan they were executing before. Intelligent reporting produces value only when it is connected to a decision-making loop that actually changes what you do.
MIT Sloan Management Review research found that data-driven organizations that built explicit decision-making rituals around their reporting were three times more likely to outperform competitors over a five-year period than organizations that collected equivalent data but lacked structured review processes.
Your dashboard should be the starting point of a conversation, not the end of one. When every metric you review is connected to a decision you have the authority to make, reporting becomes one of your highest-leverage management practices.