The gap between having data and making good decisions with it is one of the most stubborn problems in modern marketing. Most teams have more data than they can meaningfully process. They have website analytics, CRM reporting, email performance, paid media dashboards, social metrics, and customer success data all flowing into tools that are technically integrated but practically siloed.
The data is there. The decisions that should follow from it often are not.
This is not a technology problem. The tools for collecting and visualizing marketing data have never been more capable or more accessible. It is a process problem, specifically the absence of a structured workflow that transforms data from an observation into a decision and from a decision into a measurable action.
Understanding Why the Gap Exists
The analytics-to-action gap has three structural causes.
The first is metric overabundance. When every platform produces its own dashboard with its own set of performance indicators, the cognitive overhead of synthesizing across all of them exceeds the capacity of most teams. Marketers learn to default to a handful of familiar, easy-to-access numbers and effectively ignore the rest. The metrics they ignore often contain the most actionable signals.
The second cause is the absence of a decision-making framework. Data reveals what is happening. It cannot tell you what to do about it without a prior framework that defines what good looks like, what the range of possible responses is, and who has the authority to execute each response. Without this framework, data review sessions produce interesting observations and no commitments.
The third cause is temporal mismatch. By the time data has been collected, cleaned, visualized, reviewed in a meeting, debated, and turned into a plan, the window for acting on the underlying signal has often passed. Real-time markets require near-real-time decision cycles, and most marketing reporting processes are built for a weekly or monthly rhythm.
According to a Google-commissioned survey of 1,000 senior marketing executives, 89% said that making better decisions faster was a top priority for their team. But only 23% said they were satisfied with their current ability to act on data within a relevant time window.
The Decision-Ready Data Architecture
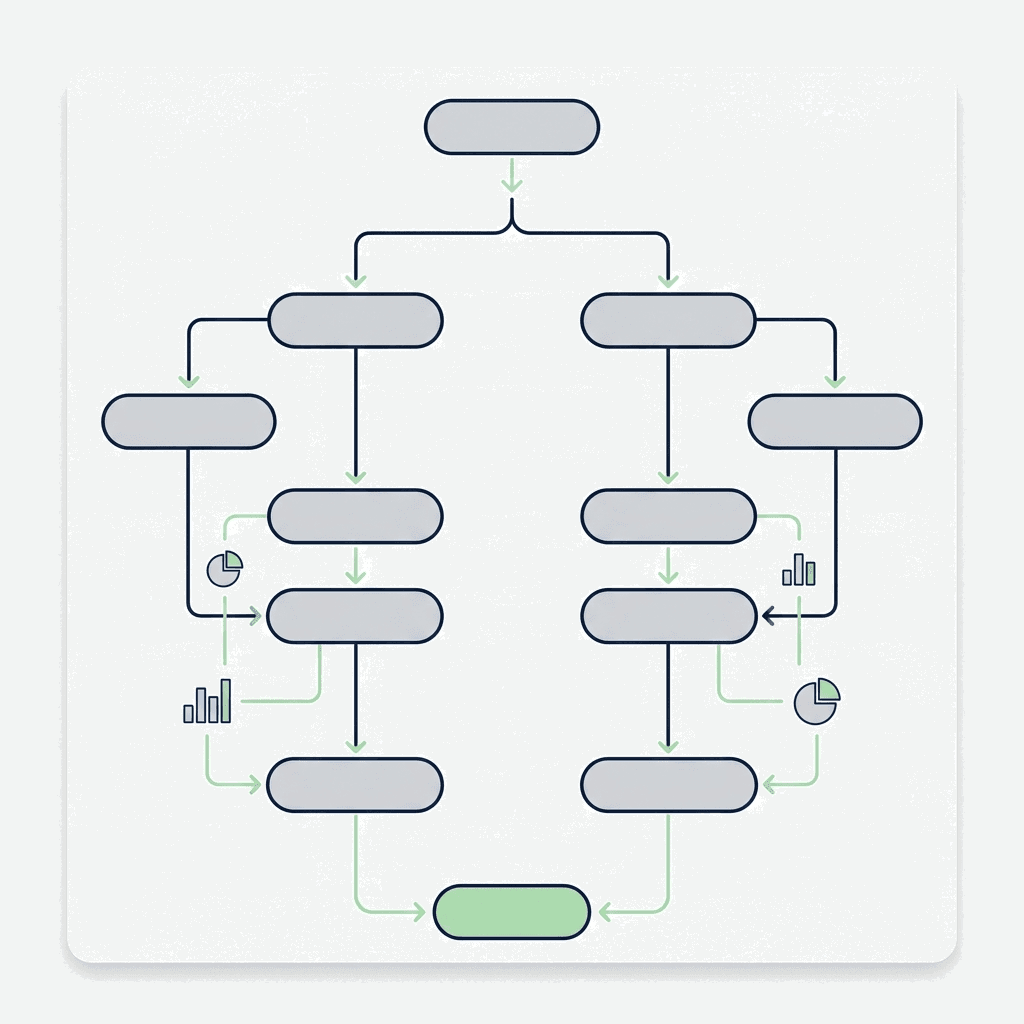
Building a data-driven decision process begins not with tooling but with definition. Before you can act on data consistently, you need to define three things explicitly.
What questions matter. Identify the five to eight strategic questions that, if answered correctly, would most directly improve your marketing outcomes. These are not reporting questions ("how many leads did we generate") but causal questions ("what content and channel combinations are producing the leads with the shortest sales cycles"). Design your measurement infrastructure around answering these specific questions rather than reporting on all available metrics.
What thresholds trigger action. For each key metric, define the performance thresholds that should trigger a response and specify what that response is. If organic traffic drops more than 15% week over week, that triggers a diagnostic investigation of the specific pages most affected. If a campaign's CPA rises above a defined ceiling, that triggers a creative review or bid adjustment. Defining these thresholds in advance removes the debate that typically slows response.
Who makes which decisions. Data paralysis is often organizational rather than analytical. When it is unclear who has authority to pause a campaign, adjust a budget, or change messaging, action slows to committee speed. Define a decision rights matrix that specifies what each team member can decide independently, what requires peer review, and what requires leadership approval.
![]()
Building Dashboards That Drive Decisions
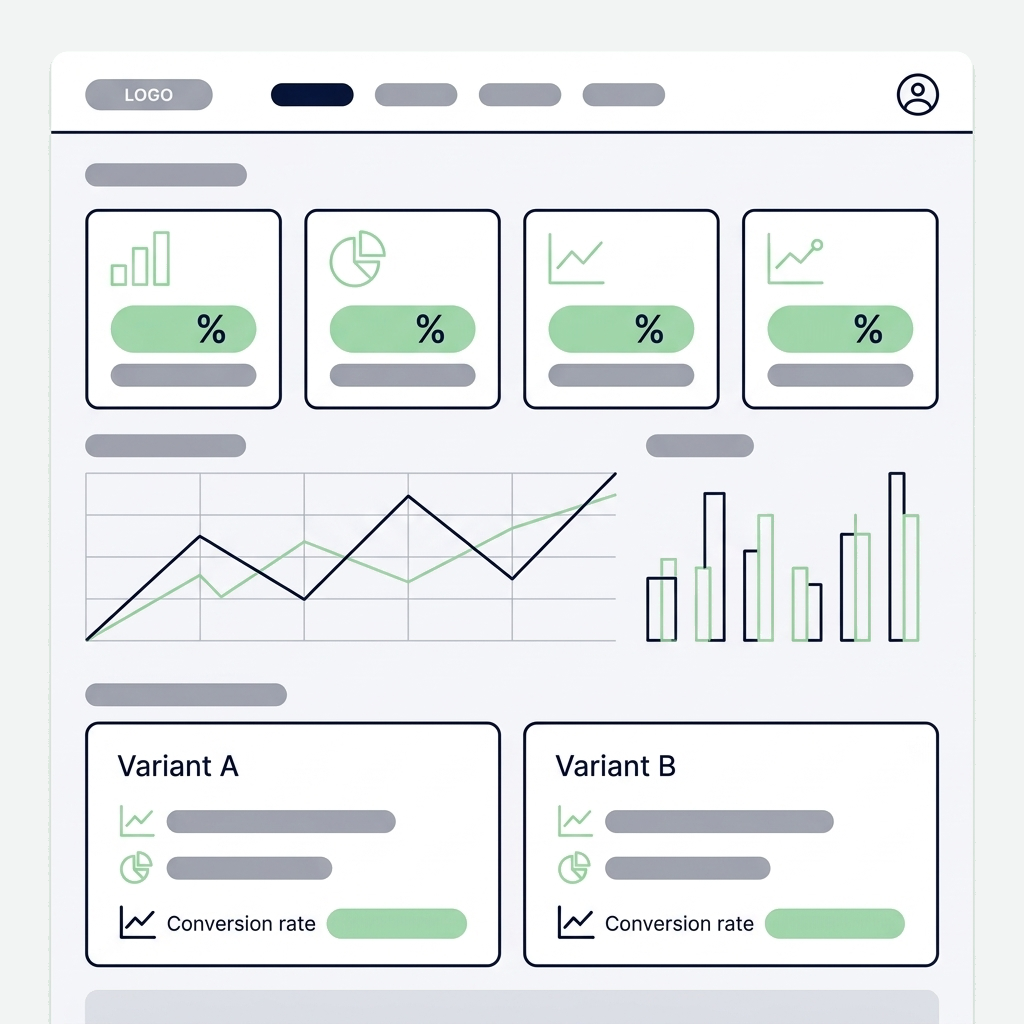
Most dashboards are designed to report history. Decision-driving dashboards are designed to surface divergence.
The difference is structural. A reporting dashboard shows you metrics as they are. A decision-driving dashboard shows you metrics as they are relative to where they should be, with the context required to understand whether the gap is meaningful and what its likely cause is.
Build your primary marketing dashboard around three views. The first is trajectory comparison: current performance versus plan, previous period, and same period last year, surfaced together so trend is immediately visible. The second is channel decomposition: when overall performance changes, which specific channels or campaigns are driving the change, allowing rapid isolation of the source. The third is leading indicator panel: the two or three metrics that your historical data shows are most predictive of downstream conversion performance.
The Tractn analytics layer is specifically designed around this decision-support model rather than the historical reporting model that most platforms default to. It surfaces divergence, identifies warnings, and connects upstream activity metrics to downstream revenue attribution.
Deloitte's Analytics Advantage survey found that companies in the top quartile of data-driven decision-making reported 5% higher productivity, 6% higher profit, and were 23x more likely to acquire customers than those in the bottom quartile.
Making the Weekly Data Ritual Work
The operational mechanism that sustains data-driven marketing is a structured weekly review with a fixed agenda.
The agenda should begin with performance against targets (ten minutes), move to deviation investigation where any metric that deviated significantly from expectation is examined for cause (fifteen minutes), then to decision commitments where the team identifies specific changes they will make this week based on the review (ten minutes), and finally to leading indicator monitoring where early signals are assessed against historical patterns (five minutes).
The forty-minute investment in this ritual, done consistently every week, compounds in value over time. Teams that maintain this discipline develop an increasingly precise intuition for what their data is telling them and increasingly short cycles between signal and response.
This rhythmic process connects directly to orchestrating your broader strategy as a whole, because data-driven teams naturally coordinate across channels when they are reviewing shared metrics together on a regular basis.
The gap between analytics and action is not closed by better tools alone. It is closed by the combination of the right data architecture, a defined decision framework, and the operational discipline to review and act consistently over time.