Visualizing Campaign Impact
A marketing operating system is only as powerful as its ability to prove ROI. Tractn OS features a highly sophisticated reporting architecture designed to map raw metrics against your strategic business goals.
This guide covers how to navigate the dual-dashboard system, utilize the Analytics engine, and construct custom presentations using the Report Builder.
1. The Dual-Dashboard System
To prevent data overwhelming the user, Tractn separates analytics into two distinct views:
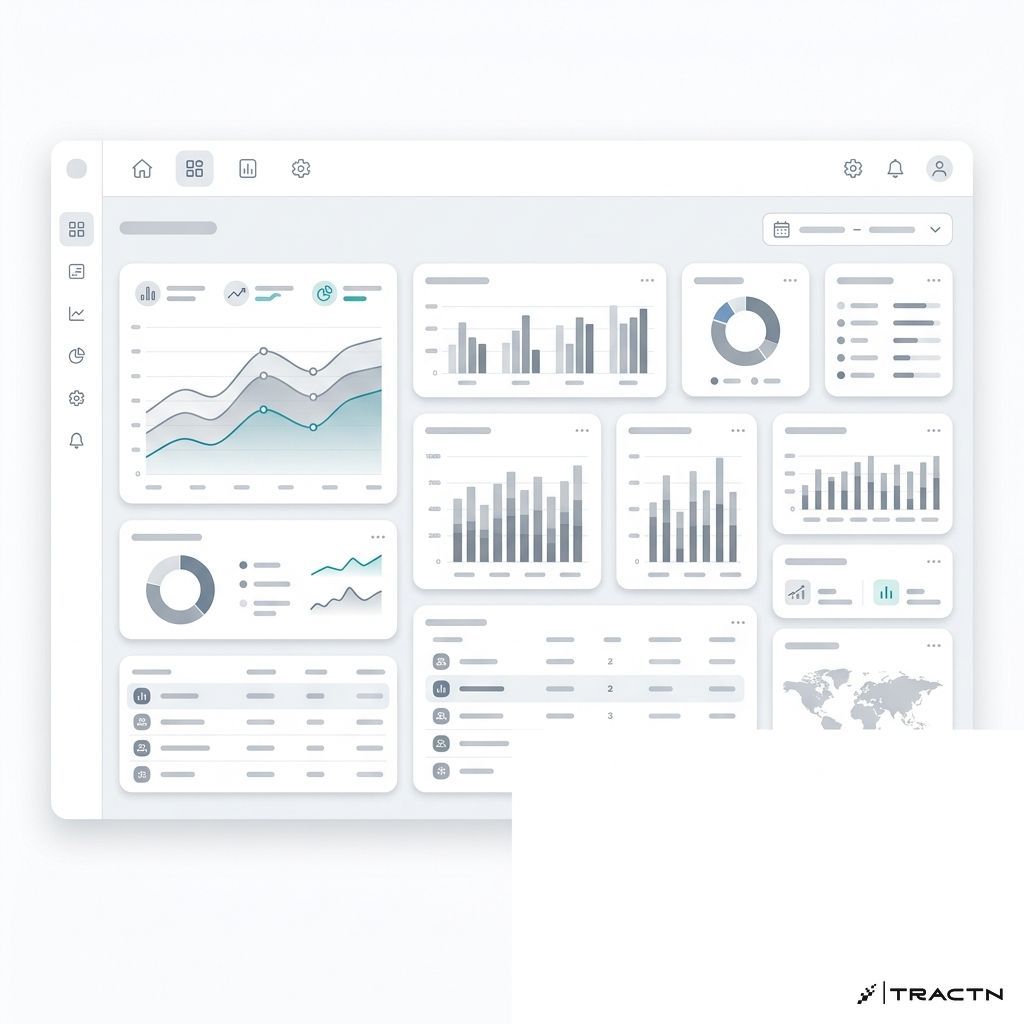
The Main Dashboard This is your global command center. The Main Dashboard aggregates data across all active and historical campaigns, providing a macroscopic view of your entire marketing organization. It tracks overarching metrics such as total lead velocity, global conversion rates, and total audience growth.
The Campaign-Level Dashboard When you drill down into a specific campaign, the interface shifts to the Campaign-Level Dashboard. This view isolates data strictly related to that specific initiative. If you are running a "Q3 SaaS Launch" campaign, this dashboard will only show the traffic, clicks, and leads generated by the specific assets tied to that campaign, allowing for granular performance reviews.
2. Navigating the Data
Both dashboards utilize a universal Date Picker utility. The date picker allows you to instantly slice the visible metrics by specific timeframes (e.g., Last 7 Days, Month-to-Date, or Custom Ranges). When you adjust the date picker, all charts, graphs, and metric cards on the dashboard dynamically re-render to reflect the selected period.
3. The Analytics Engine
Running quietly behind these dashboards is the Analytics System. This engine continuously reads the cross-platform performance data and maps the results directly against the original goals defined during the Campaign creation phase.
Instead of just presenting raw numbers, the Analytics system interprets the data. It tells the user what the numbers mean, offers actionable advice on how to improve underperforming assets, and explicitly details how the marketing metrics are impacting the overarching business goals.
4. The Drag-and-Drop Report Builder
While dashboards are excellent for internal tracking, stakeholders often require formatted presentations. Tractn OS includes a powerful Report Builder for this exact purpose.
The Report Builder is an interactive, drag-and-drop canvas.
- Widgets: You can drag specific metric widgets (e.g., a line chart of lead growth, a pie chart of attribution sources) directly from the dashboard and drop them onto the report canvas.
- Customization: You can add text blocks to provide narrative context to the data, resize charts, and organize the layout to tell a compelling story.
- Export: Once the report is constructed, it can be exported as a clean, branded PDF or shared via a secure link with clients or executives.
By utilizing the dual dashboards for daily monitoring and the Report Builder for stakeholder communication, marketing teams maintain complete visibility over their campaign ROI.